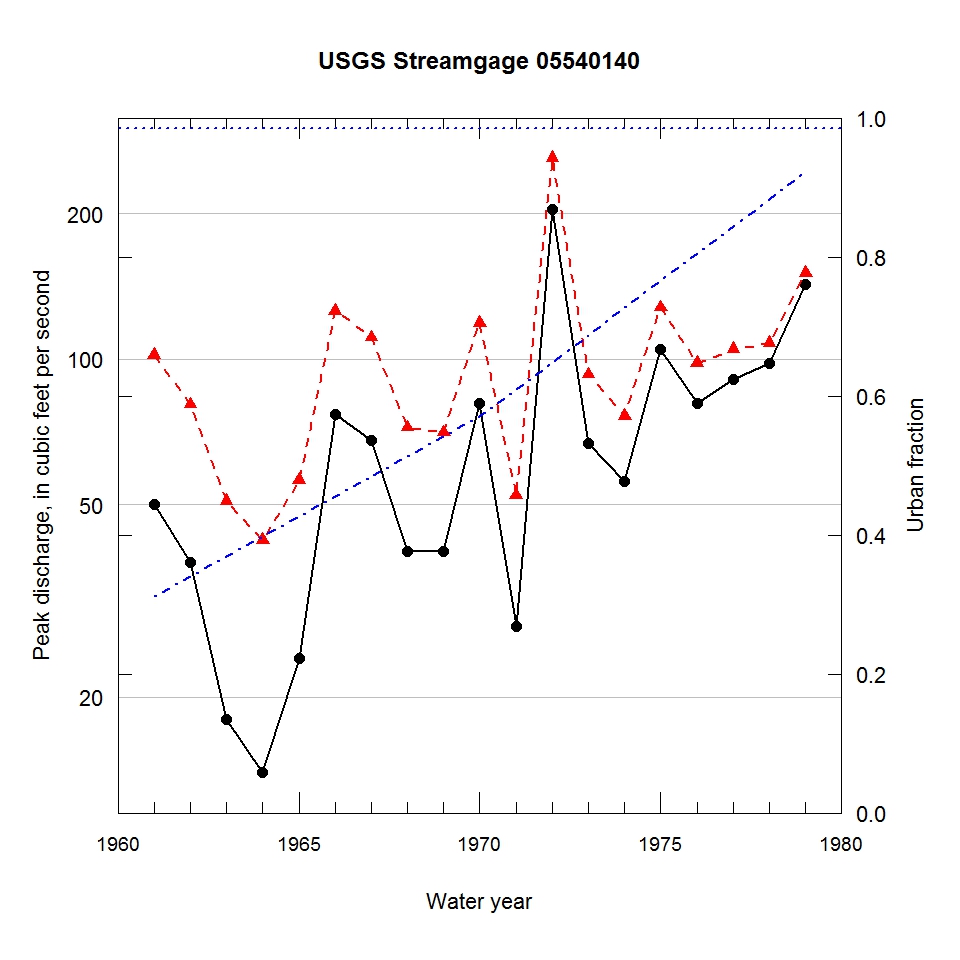
Observed and urbanization-adjusted annual maximum peak discharge and associated urban fraction and precipitation values at USGS streamgage:
05540140 EAST BRANCH DU PAGE RIVER NEAR BLOOMINGDALE, IL


| Water year | Segment | Discharge code | Cumulative reservoir storage (acre-feet) | Urban fraction | Precipitation (inches) | Observed peak discharge (ft3/s) | Adjusted peak discharge (ft3/s) | Exceedance probability |
| 1961 | 1 | -- | 0 | 0.312 | 1.885 | 50 | 102 | 0.367 |
| 1962 | 1 | -- | 0 | 0.341 | 0.249 | 38 | 81 | 0.607 |
| 1963 | 1 | -- | 0 | 0.370 | 1.147 | 18 | 51 | 0.932 |
| 1964 | 1 | -- | 0 | 0.398 | 0.780 | 14 | 42 | 0.963 |
| 1965 | 1 | -- | 0 | 0.427 | 0.099 | 24 | 56 | 0.890 |
| 1966 | 1 | -- | 0 | 0.456 | 1.371 | 77 | 126 | 0.177 |
| 1967 | 1 | -- | 0 | 0.484 | 1.457 | 68 | 111 | 0.265 |
| 1968 | 1 | -- | 0 | 0.513 | 1.251 | 40 | 72 | 0.715 |
| 1969 | 1 | -- | 0 | 0.542 | 1.294 | 40 | 70 | 0.738 |
| 1970 | 1 | -- | 0 | 0.570 | 1.277 | 81 | 119 | 0.204 |
| 1971 | 1 | -- | 0 | 0.610 | 0.364 | 28 | 52 | 0.926 |
| 1972 | 1 | -- | 0 | 0.649 | 1.170 | 204 | 261 | 0.014 |
| 1973 | 1 | -- | 0 | 0.688 | 0.808 | 67 | 93 | 0.463 |
| 1974 | 1 | -- | 0 | 0.727 | 1.047 | 56 | 76 | 0.661 |
| 1975 | 1 | -- | 0 | 0.766 | 1.016 | 105 | 128 | 0.168 |
| 1976 | 1 | -- | 0 | 0.805 | 0.874 | 81 | 98 | 0.406 |
| 1977 | 1 | -- | 0 | 0.844 | 0.608 | 91 | 105 | 0.320 |
| 1978 | 1 | -- | 0 | 0.883 | 1.488 | 98 | 108 | 0.284 |
| 1979 | 1 | -- | 0 | 0.922 | 0.783 | 143 | 151 | 0.092 |

